21st Capital Bitcoin Model
Advanced cycle-based Bitcoin price analysis and forecasting
21st Capital Model Charts
Bitcoin Cycle Model
Bitcoin Cycle Model Summary
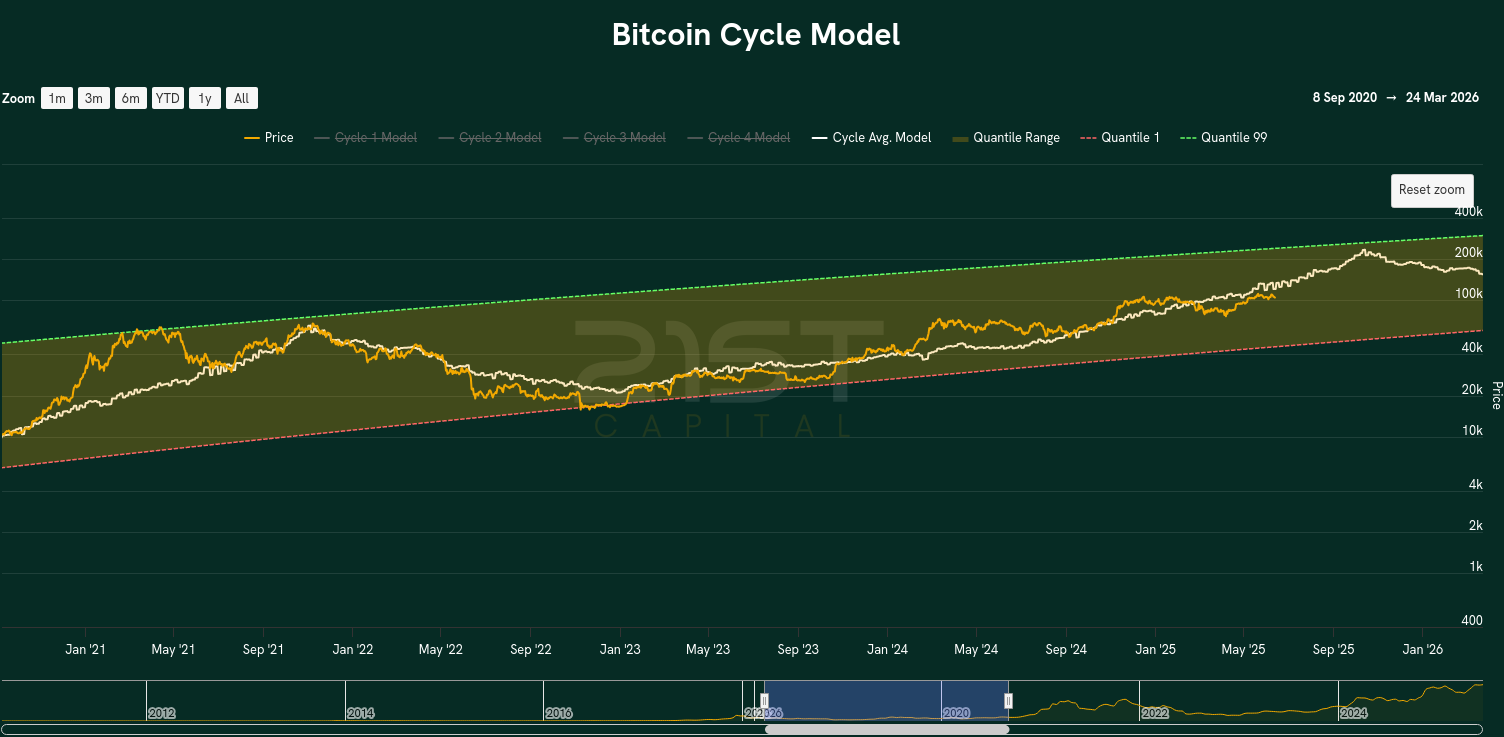
We introduce the Bitcoin Cycle Model that integrates historical cycle patterns with the outputs of a Quantile Model (QM) to enhance its predictive power by adding a timing dimension. This approach overlays cyclical dynamics onto the statistical framework of QM, allowing for more precise interpretation of where we are in Bitcoin cycles.
The white curve in the accompanying chart represents the model's forecast, derived from the average trajectory of prior market cycles. This allows one to compare current market behavior with historical patterns.
While the current cycle may appear less dramatic than previous ones, this is consistent with expectations. Growth in later cycles often shows diminishing returns, especially when factors such as ETF flows and election-related optimism (e.g., Trump's election) have already pulled some performance forward.
Despite the moderation in momentum, the overall structure remains intact—we continue to rhyme past cycles, albeit with attenuated gains, which is entirely in line with the model's expectations.
- Integrates historical cycle patterns with Quantile Model outputs
- Adds timing dimension to statistical frameworks
- White curve forecast derived from average trajectory of prior cycles
- Accounts for diminishing returns in later cycles
- Considers external factors like ETF flows and election impacts
Bitcoin Quantitative Model
Bitcoin Quantitative Model Summary
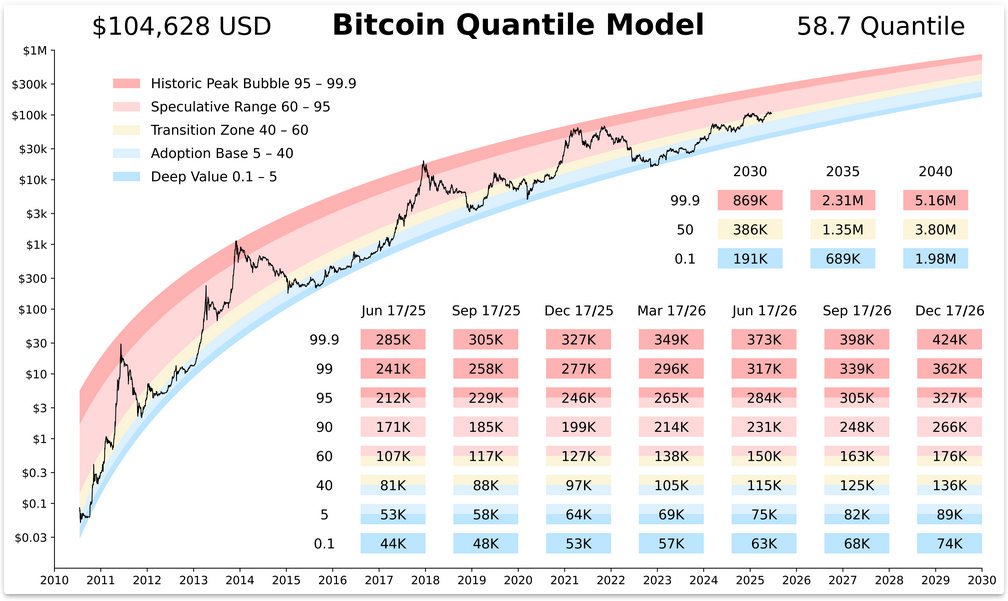
The Bitcoin Quantile Model is a statistical approach that optimizes the fitting of lines to different portions of Bitcoin's historical price distribution. Unlike traditional models that rely on averages, such as the Power Law (PL) model, the Quantile Model applies quantile regression to capture the skewed nature of Bitcoin's price movements. Specifically, it determines the best-fitting lines for extreme quantiles, such as the 1st percentile (Q1) and 99th percentile (Q99), ensuring that the model accurately represents Bitcoin's price extremes without manual data adjustments.
This is crucial because Bitcoin's price data exhibits both asymmetry and diminishing volatility, making standard deviation-based models less effective in predicting long-term trends. Compared to the OLS models with standard deviation bands, the Quantile Model provides a more robust framework for capturing Bitcoin's behavior. Due to Bitcoin's asymmetric and diminishing volatility, standard deviation bands can diverge from actual price movements.
The Quantile Model addresses this issue by incorporating the natural skewness of Bitcoin's price distribution, ensuring that peaks and bottoms are better captured. Additionally, it offers a single, unified framework without requiring analysts to manually adjust or manipulate data, reducing bias and improving reliability in long-term forecasting.
The theoretical foundation of the Quantile Model lies in quantile regression, an extension of ordinary least squares (OLS) regression that models conditional quantiles rather than just the mean. In the context of Bitcoin, this allows the model to establish a probabilistic range of potential prices instead of a single expected value. The Q99 line, for example, defines the level below which 99% of Bitcoin's historical prices fall, while the Q1 line represents the lowest 1%. By extrapolating these quantiles into the future, the model projects Bitcoin's price channel, with estimates suggesting a potential upper bound near $1M by 2030.
- Uses quantile regression instead of traditional averaging methods
- Captures extreme quantiles (Q1 and Q99) for price distribution
- Accounts for Bitcoin's asymmetric and diminishing volatility
- No manual data adjustments required, reducing bias
- Projects probabilistic price ranges rather than single values
- Estimates potential upper bound near $1M by 2030
Bitcoin VPLI Analysis
Bitcoin VPLI Analysis Summary
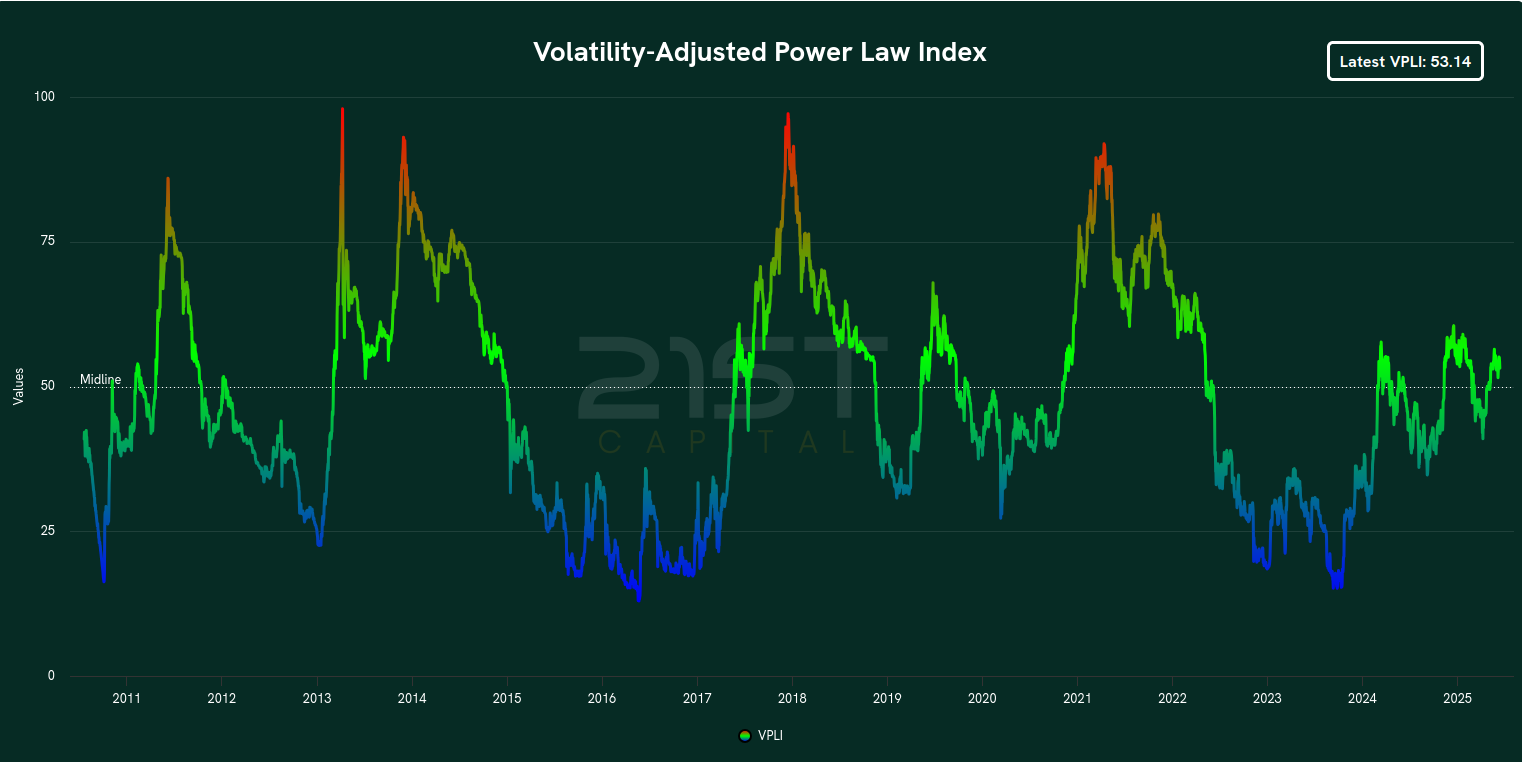
The Volatility Adjusted Power Law Index (also known as the "VPLI") is a Power Law chart that incorporates volatility adjustments where other Bitcoin charts do not. By correcting for volatility, this model helps provide investors and analysts with clear Bitcoin value regions indicating across the Bitcoin lifecycle.
When the chart is "hot" (indicated by red values on the chart), this represents that Bitcoin is overbought relative to its historical average. When the chart is "cold" (indicated by blue values on the chart), this represents that Bitcoin is oversold relative to its historical average.
- Power Law chart with volatility adjustments
- Provides clear Bitcoin value regions across lifecycle
- Hot/red values indicate overbought conditions
- Cold/blue values indicate oversold conditions
- Helps identify optimal entry and exit points
- Accounts for volatility where other models do not
Important Disclaimer
The 21st Capital model is provided for informational and educational purposes only. This analysis does not constitute financial advice and should not be used as the sole basis for investment decisions. Bitcoin investments carry significant risk and past performance does not guarantee future results.